
In the current virtual realm, data visualization or data science shapes business strategies and has become a decisive part of business operations. One of these techniques – the parallel coordinates plot – has become invaluable in revealing hidden patterns and obtaining multidimensional data insights.
In this article, we will take you on a journey into the world of parallel coordinate plots, their application in businesses, and their significance in decision-making. Keep reading to unearth these insights.
The value of using a parallel coordinate plot lies in its ability to visualize high-dimensional data. This plot defines a unique way to represent multidimensional points in a two-dimensional plane, allowing users to identify correlations and outliers.
In a coordinate plot, each variable in the dataset is represented by a vertical axis, and all the axes are similar to each other. Every data point is represented by a polyline, which crosses each axis at the corresponding value, offering an intuitive and compact way to handle multivariate data.
This technique is highly valuable in various fields such as computer science, data analysis, and even astronomy. It particularly stands out in situations where traditional scatter plots fail to make sense of the data.
And it’s not just for high-level science. With a bit of understanding and the right tools, coordinates can serve anyone looking to extract deep insights from complex multidimensional datasets.
Statistics:
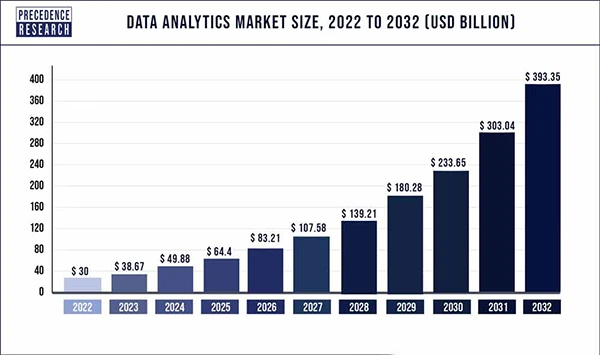
It is predicted that the Data Analytics Market Size will surpass USD 393.35 Billion by 2032.
In the realm of business analytics, parallel coordinates can serve as a powerful tool for unveiling hidden trends within masses of data. They can provide businesses with a more in-depth examination of their processes and results, assisting in the identification of potential opportunities and pitfalls.
For instance, in customer behavior analysis, they offer a comprehensive view of transactional history across several variables such as product categories, geographies, and time periods. This bird’s eye view can help businesses to discern the behavior patterns of various customer segments.
Similarly, in the financial sector, they can facilitate the visualization of a rich market data set, for instance, plotting the performance of multiple stocks over a certain period. This makes it possibly easier for financial analysts to pinpoint economic trends for better decision-making.
The process of creating a plot commences with the selection of the right dataset. The chosen data should be multidimensional, meaning it should include multiple variables that require simultaneous examination.
Once the data is prepared, each variable is represented as a vertical line, equally spaced, and parallel to each other. Then, every individual data item is projected as a line intersecting these vertical lines.
The next step involves adjusting the plot for visibility. This might mean normalizing data to prevent bias from high-value variables, or coloring lines to distinguish between different categories or groups of data.
Finally, business analysts interact with the plot, identifying and exploring trends, patterns, clusters, or outliers that emerge. The plot can also be enhanced with interactive features, allowing users to manipulate variables and view the data from multiple perspectives.
DID YOU KNOW?
Business statistics is widely used for forecasting, testing correlations, and describing data.

With parallel coordinates, viewing trends or patterns becomes much easier. Looking at the poly-lines, one can easily identify similar trends as they will share a similar pattern or “flow.”
Distinguishing outliers or anomalies is also more straightforward. Points that do not follow the traditional trend will clearly stand out, aiding in further investigative analysis. Clusters can easily be identified as groups of lines following similar trends. This can be enhanced further by using colors to categorize and represent different clusters or classifications.
As such, an adept interpretation of these plots can serve as a guiding light for businesses in making informed and reliable decisions. The sky is truly the limit, from sales forecasting to anomaly detection amongst a vast set of variables.
Altogether, its adoption and effective use could be the missing link between businesses and their quest for in-depth, high-dimensional data insights. As more enterprises progressively grapple with large, complex datasets, this visualization technique could make a significant difference, transforming raw data into valuable business intelligence.

Freelancer